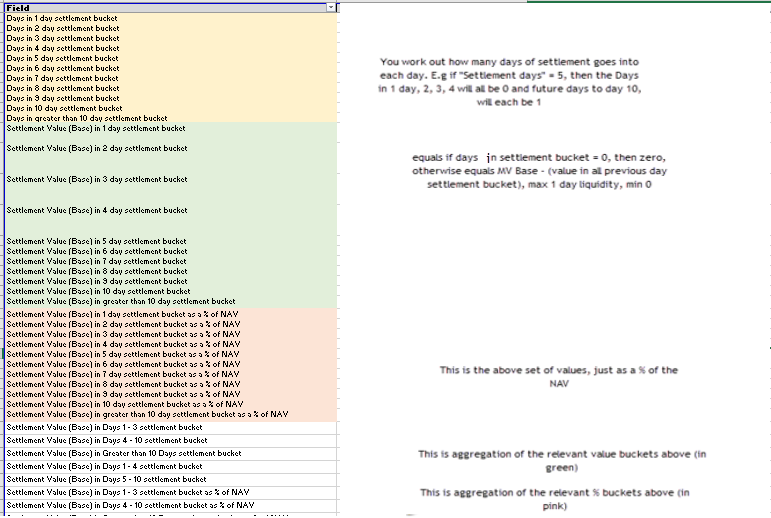
Whilst there are many calculations (40+), they are very repetitive and all stem from only a small amount of background information and break down into miscellaneous calculations and 5 big categories, as per the below.
Notes on Calculations

Whilst there are many calculations (40+), they are very repetitive and all stem from only a small amount of background information and break down into miscellaneous calculations and 5 big categories, as per the below.
Notes on Calculations
A calculation is made of how much value of the stock can be liquidated in one day.
This is calculated by:
However, this is limited to a maximum of the Market Value (base) actually held.
This is calculated as: Absolute (Market value (Base) / “1 day liquidity – current MV Base.”)
It does not use: Quantity / 1 day trading volume captured QTY, due to the face that “1 day trading volume captured QTY” will be blank, where traded volume is blank.
Also, negative results are turned into absolutes, as negative numbers would make no sense
This is calculated as “Trade days to totally liquidate” + “Settlement days”
Where “settlement days” is blank, then use “11” in this calculation as a substitute for “settlement days.”
For the other calculations, see the Excel “2. Liquidity Calculations Specification”
This is the MV (Base) / NAV as a percentage multiplied by the settlement Days to Totally Liquidate.
This is the Qty multiplied by the Anticipated level of monthly trading.
This is a comparison between “1 day trading volume captured Qty” and the “Anticipated Monthly Trading Qty”. For this purpose“1 day trading volume captured Qty” is multiplied by 20, to make it a monthly figure and then divided by the “Anticipated Monthly Trading Qty”.
There are then 5 big groups of calculations as summarised below.

See the Excel “3. Liquidity Calculation examples” which has a range of scenarios including: