All of the calculations are based upon a small number of inputs:

- Quantity
- MV (Base)
- Settlement days
- Traded Qty (which comes from Average traded volume (60 days)
- Assumed Market Capture Level
These are described below.
This is the quantity and market value (base) that come from the uploaded Portfolio holdings files.
When you buy or sell an equity / bond etc., there is a delay in settlement. E.g. if you sell an equity today, it may 3 days (T+3) until you actually give away the equity and get in the cash. As liquidity monitoring is concerned with how quickly you can get to cash, the settlement days is an important part of the calculation.
Settlement Days field
Note: the data field required for the calculations may change later. We assume for now that settlement days comes from the security data field of settlement days, described below. Later, this will need to be updated with some system logic, maybe another field, that deals with situations where the settlement date field is not populated.
There is a security data field for “settlement days.” This uploads for some securities how many days the settlement timeframe is.
However, this is really only provided equities and a small number of bonds. It will not be provided for open end funds, deposits, derivatives etc.
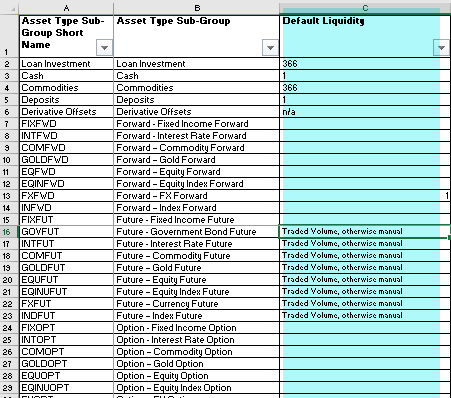
Accordingly, in the same field, or in a different field, we have the default against the instrument of the settlement days. E.g. we know that cash will have a default of 1 day, whereas a loan or property will have a default of 366 days.
These defaults can be found in the Table “Asset Sub-Groups” in the column “Default liquidity”.

Missing settlement days
There is a default in the system for holdings that do not have a defined settlement cycle. These will default to an instrument settlement cycle of 10 days, prompting attention.
Where the asset type should have a defined settlement cycle, then the first appropriate action is to consider the asset sub-group of that asset type and the default liquidity days implemented for that asset sub-group.
This is the average daily traded volume (as a quantity) that is actually traded in the market (e.g. on the stock exchange). There are a range of statistics available, including the average daily traded volume based on the average of the latest 1 day, 30 days, 60 days, 90 days etc.
Whilst we can map each of these into the system, for now the Traded Volume (Qty) comes from what is populated as the “Average trading volume – 60 days.” In the future, we may make it possible for the client to specify which of the traded volume figures to use.
Missing Traded Volumes (Qty)
As described above, daily trading volume is a key input to the calculations. We will have this for most equities and a range of bonds. We also have it for standard futures contracts.
However, there will be many instruments for which we do not have the trading volume.
This includes the following range of assets types, including: CONV CUMULATIVE PREFERENCE; EQUITY SOME SHS RESTRICTED TO DOMESTIC RESIDENTS; NON-CUMULATIVE PREFERENCE; PARTICIPATING NON-CUMULATIVE; CUMULATIVE PREFERENCE; EQUITY ALL SHS RESTRICTED TO DOMESTIC RESIDENTS). Unlisted/liquidated equities will have no volumes.
Where trading volumes are missing, they stay blank. Blanks can then be investigated.
Say you hold 10,000 quantity of an equity, how long it will take to sell that 10,000 depends on how much daily trading there is. E.g. if there is only 2,000 of daily trading volume, then it will take 5 days to liquidate. However, this assumes that you can capture 100% of daily trading, whereas 5%, 10% or 20% may be a more realistic approach.
Accordingly, in our calculations, we provide a variable for the clients Assumed Market Capture level. This is a percentage and defaults to 20%
For now, we have an assumed market capture level, fixed at 20%, but we should change to be a Manager level parameter in Organisation.